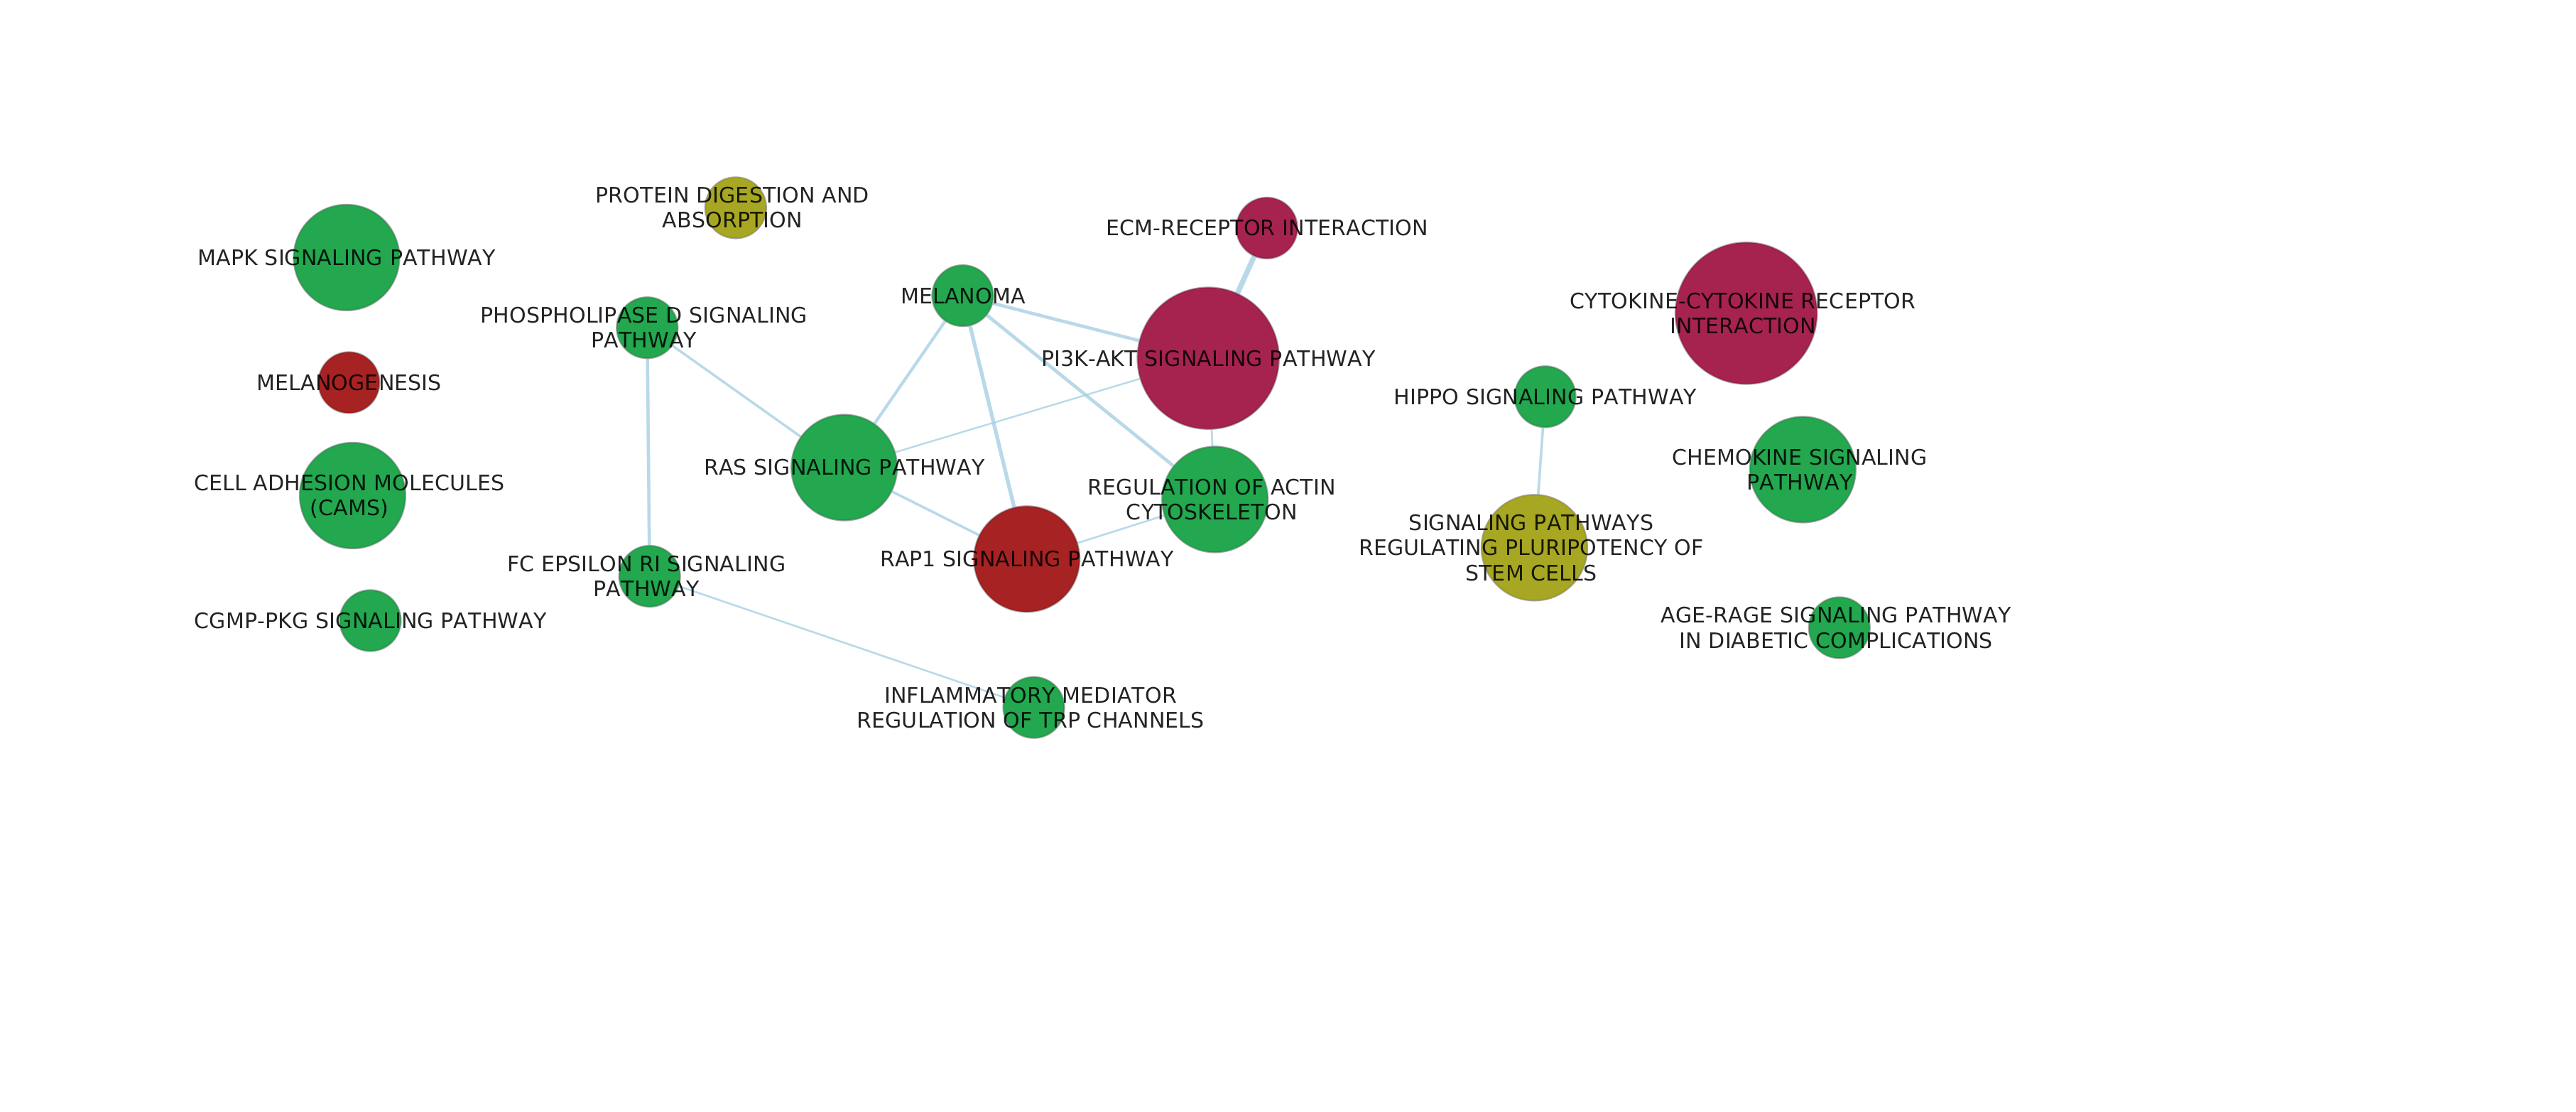
Pathway enrichment graph.
Size of node represents enrichment. larger the node more is enrichment.
Color represents significance, red color nodes are highly significant, followed by green and yellow.
Hierarchical clustering analysis exploring the difference in gene expression between White, Black and Brown pashmina coat colour. Each row in the map represents a differentially expressed gene and column represents condition used. Log10(FPKM) value is used for constructing heat-map.